Using regressions panel
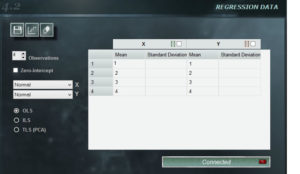
 The regression panel of MCM Infinite Alchimia allows great flexibility when constructing a calibration curve for our test model.
Panel Features
1. Menu buttons In the upper left section of the panel there are three buttons that are unique to this panel.
![]() Save. Allows you to save the data entered for the curve. This data is saved independently of the model. In this way you can use the same curve in other models and, conversely, use other calibration curves in the same model when necessary. The curves will be saved with extension .mcr.
Save. Allows you to save the data entered for the curve. This data is saved independently of the model. In this way you can use the same curve in other models and, conversely, use other calibration curves in the same model when necessary. The curves will be saved with extension .mcr.
![]()
Open curve. This button allows you to open a previously saved MCM Alchimia curve. Opening a curve does not imply that it is connected, so after opening it, you must press the connect button so that it is connected.
![]() Clear data. Deletes all the data entered in the panel.
Clear data. Deletes all the data entered in the panel.
& nbsp;
2. Number of observations. Using the forward and back buttons, the number of observations we will use to define the curve can be modified. The software offers 5 by default, but an unlimited number of observation can be indicated with a minimum of 3.
3. Intercept with zero. Selecting this option will result in an independent term = 0, regardless of the input values. In certain situations, this restriction can be defined by the knowledge of the process, for which this option is available.
4. Distribution menu. In the upper right corner of this panel are the drop-down menus where we can select probability distributions, both for the independent term, and for the dependent one. The distributions available in these combos are: Constant, Rectangular, Triangular and Normal.
If you select Constant, you are assuming that the entries on that axis have no uncertainty so the property column will be inactive and data can not be entered. In other cases, the standard deviation should be defined for the case of the normal distribution or the semi-interval for the rectangular or triangular.
5. Data panel. In this field you enter the average values of x and y , as well as the properties of the distribution we choose for each axis. Important! This panel allows you to copy and paste data from any worksheet with the same form. If the copied range has larger dimensions than those indicated in the data panel, the remaining data will be truncated. The cell selected in the panel will be the upper-left cell of the copied range.
In the title cell of each axis there is a check box. Pressing this box the data of the first row of data of that axis will be copied in all the following rows.
6. Minimal square selector. In this selector we select the type of least squares method that will be used to obtain the calibration curve.
- OLS. Ordinary Least Squares. The curve obtained through this method will be the one for which the quadratic sum of the residuals in y is minimal.
- ILS. Inverse Least Squares. The curve obtained through this method will be the one for which the quadratic sum of the residuals in x is minimal.
- TLS (PCA). Total Least Squares. The curve obtained through this method will be the one for which the quadratic sum of the orthogonal residuals to the curve is minimal.


