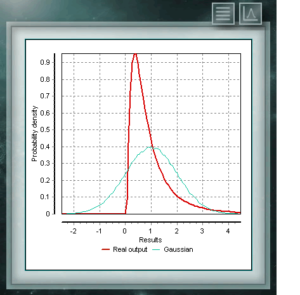
Lognormal distribution
 This distribution represents random variables whose logarithms are distributed according to a normal distribution. The lognormal distribution takes different forms depending on the value of its scale parameter and is often used in the reliability of high technology products and also in microbiological counts since they are based on the multiplicative growth model.
Input parameters:
As indicated, the logarithms of the values of the lognormal random variable are distributed according to a gaussian function. This distribution function can be defined from two sets of parameters as selected in the radio buttons on the right of the data panel.
- μ (Y). Average population Y data. This Y population will be defined according to the group of data that we wish to refer to, that is, to the lognormal population or the normal population of their logarithms.
- s (Y). Standard deviation of Y. With Y according to the characteristics indicated above.
- Y = X (LogNormal) / Y = ln (X) (Normal). This selector allows you to choose which data group the input parameters are referring to.
- Y = X (LogNormal). In this first case the generated pseudo-random values will form a lognormal distribution whose mean will be μ (Y) and its standard deviation will be s (Y).
- Y = ln (X) (Normal). In this case the generated values will be distributed in LogNormal form. The set formed by the logarithms of these data will have a Normal distribution whose mean will be μ (Y) and its standard deviation will be s (Y) .
More help

