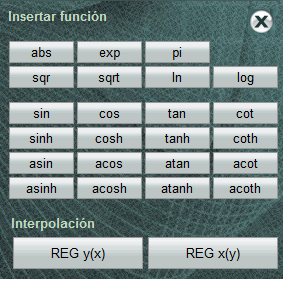
 To open the function keyboard, click on the f (x) link that is located on the equation editor when we position ourselves on it.
In the lower section of the function keyboard, there are two interpolation buttons that allow you to obtain linear interpolation results in the connected curve. These generic variables perform not only the interpolation in the curve but also perform the uncertainty estimation of it, integrating its contribution to the model.
It is important to understand that this calculation does not represent what is usually done when we do it manually, but it integrates all the tools available in the simulation of the model, as well as the data obtained during the simulation of the connected curve.
REG_y (x). Interpolates the observed response ( y ) of an indicated value from x axis, estimating its associated total uncertainty. The value of x can be numerical, a variable or even part of the model equation. For example REG_y (5), REG_y (A) or REG_y (coef_a * ABS (A1-A2)).
REG_x (y). Given a value, variable or fragment of the equation corresponding to y axis, interpolate and estimate the associated uncertainty of the corresponding value of x .
Uncertainty of interpolation.

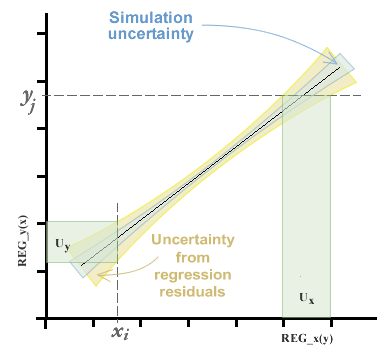
In the chapter on Using the calibration curve panel we saw that we could estimate the curve of best fit by the method of ordinary, inverse and total least squares (the latter by means of the method of analysis of the primary component). Whichever method is chosen, we will obtain coefficients of the equation of the line, in addition to a range of variable uncertainty along the curve, composed of the uncertainty of simulation and that contributed by the variance of the residuals. This topic can be seen in more depth in the chapter of regressions and curves .
The uncertainty in the interpolation, then, will be given by the standard error of the curve in the axis from which it intends to interpolate.

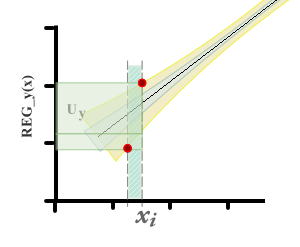
It can be seen that there are two differences with respect to the method that is usually used to estimate uncertainty in calibration curves. First, zero uncertainty is not expected on the x axis.
On the other hand, when you want to estimate the value of x i from a y i observed, the uncertainty interval in x is taken from the residual variance in x . In the graphs you can see a representation of the uncertainty of the measurand in each case.

