First project – Results
When the Start Simulation button is pressed, a bar can be seen under the button that continuously indicates the progress of random sampling. After completing the simulation with the indicated data, the application is automatically located in the results panel.
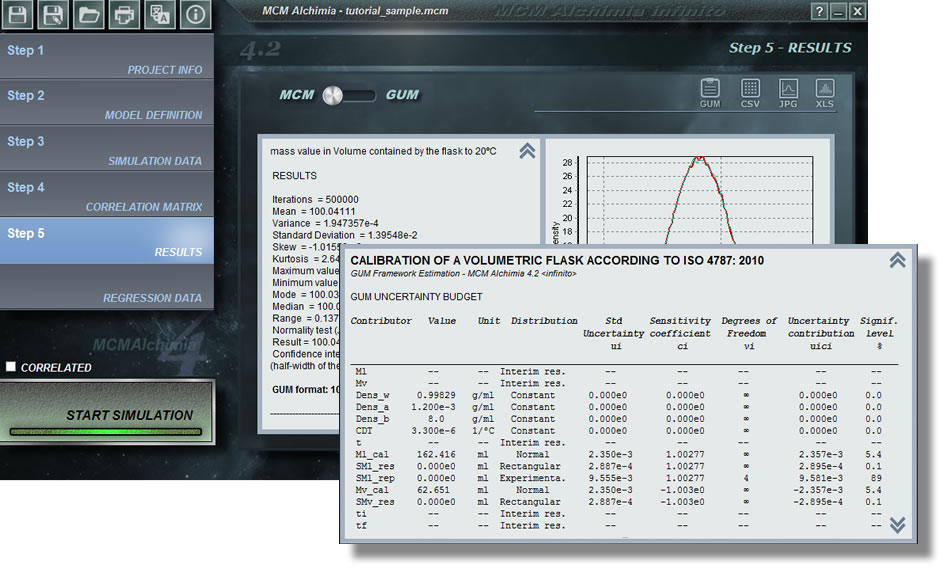
This panel shows a graphic selector at the top left, which allows to toggle between the results of the Monte Carlo simulation and the analysis according to the GUM approach, which is also estimated as well in all cases.
Next, we analyze the information provided by the MCM results view:
- Name of the application.
- Software version.
- Time involved by the application in obtaining results (in mm.ss, minutes and seconds)
- Technical data, with the text that we indicated in Step 1
- Number of iterations. 500 000 in our case.
- Statistical analysis of simulation
- Media = 100.04111
- Variance = 1.947357e-4
- Standard deviation = 1.39548e-2
- Skew = -1.01559e-3
- Kurtosis = 2.64392
- Maximum value = 100.11192
- Minimum value = 99,97472
- Median = 100.0396
- Range = 0.1372
- Normality Test (Jarque – Bera) = 2641.5964 (does not fit)
- Result = 100.04111. This indicates the result of the calibration without rounding figures.
- Confidence interval (p = 95.45%): [100.01376, 100.06841] (Half-width of the interval = 2.733e-2)
- Classic format: 100.041 ± 0.027 ml. This represents the test result and its associated expanded uncertainty for the coverage probability indicated in step 3. Note that this is not the result from GUM framework but the MCM results expressed as usual in GUM framework
- List of contributions to the uncertainty for each parameter of the model.
- Section with input data and mathematical model describing completely what was entered when creating the simulation project.

More help

